What do you think when you hear the word ‘renewable energy’? Solar, right? However, when we say renewable energy, it is not just solar; there are other renewable energy sources that are included, like wind energy, hydro energy, bioenergy, etc. Solar is the most popular form of renewable energy because, lately, we have seen a lot of rooftop solar installations at homes and industries.
Now, the bigger question – Will we see good wind installations in the coming years nationwide? The simple answer to that question is yes. Solar produces electricity only during the day, whereas when we talk about wind, the wind can produce electricity both during the day and at night. However, wind energy generation is higher at night as compared to day time because the speed of wind at night is much higher. Thus, we can say that it is never going to be wind vs solar, it will always be wind with solar. A combination of these two is called a hybrid power plant. The net realization of hybrid power plants is higher than that of vanilla wind or vanilla solar power plants, which in turn increases profitability for the power producer.
Cost and Profitability Analysis
We usually have the perception that producing electricity through solar is a cheaper source than producing electricity through wind. Let’s dive deep into the matter and check by some statistics.
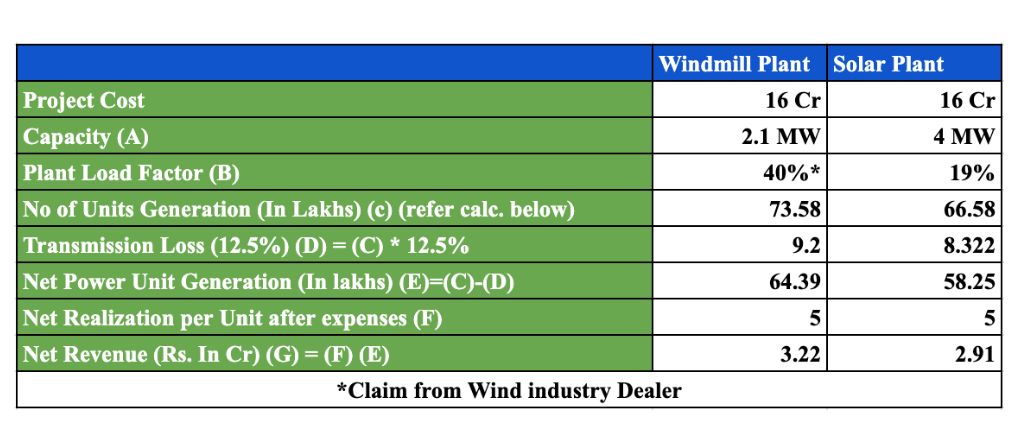
The prices in the table are indicative of the average prices that are prevalent in the market as there is a lot of volatility in solar module prices. We have assumed Rs. 5 per unit as a constant tariff which a power producer can get by selling per unit of electricity generated.
No. of units generated = Rated Capacity(A) * 1,000 (converting it to kilowatts) * 24 (No. of hours in a day) * 365 (no. of days in a year) * Plant load factor of a plant(B).
As we can see from the table, even when you invest an equal amount of money in both solar and wind, the total plant capacity of solar is higher than wind plant. However, the net units generated are higher in wind. This is because of the difference in PLF (Plant Load Factor). PLF is a measure of the average capacity at which it can generate electricity. Taking into consideration all the factors above, we can see, wind as a renewable resource is as profitable as solar.
Apart from the quantitative factors, there are also qualitative factors which would affect wind installations in the country. Currently, solar installations in the country are more than wind installations. But, the country cannot just have solar on the grid. Solar produces electricity only during the day and thus creates a lot of pressure on the grid to transmit electricity. The electricity produced in the day cannot be used in the night, unless we store the electricity, again posing a lot of challenges and thus, we need to have an alternative source of electricity generation. Here, wind comes to our rescue. Wind is very efficient in producing electricity in non-solar hours, thus making it a good source of energy generation.
Now let’s see if India as a country is capable of installing wind-powered plants at the capacity that it is actually targeting.
India’s strategic geographical location
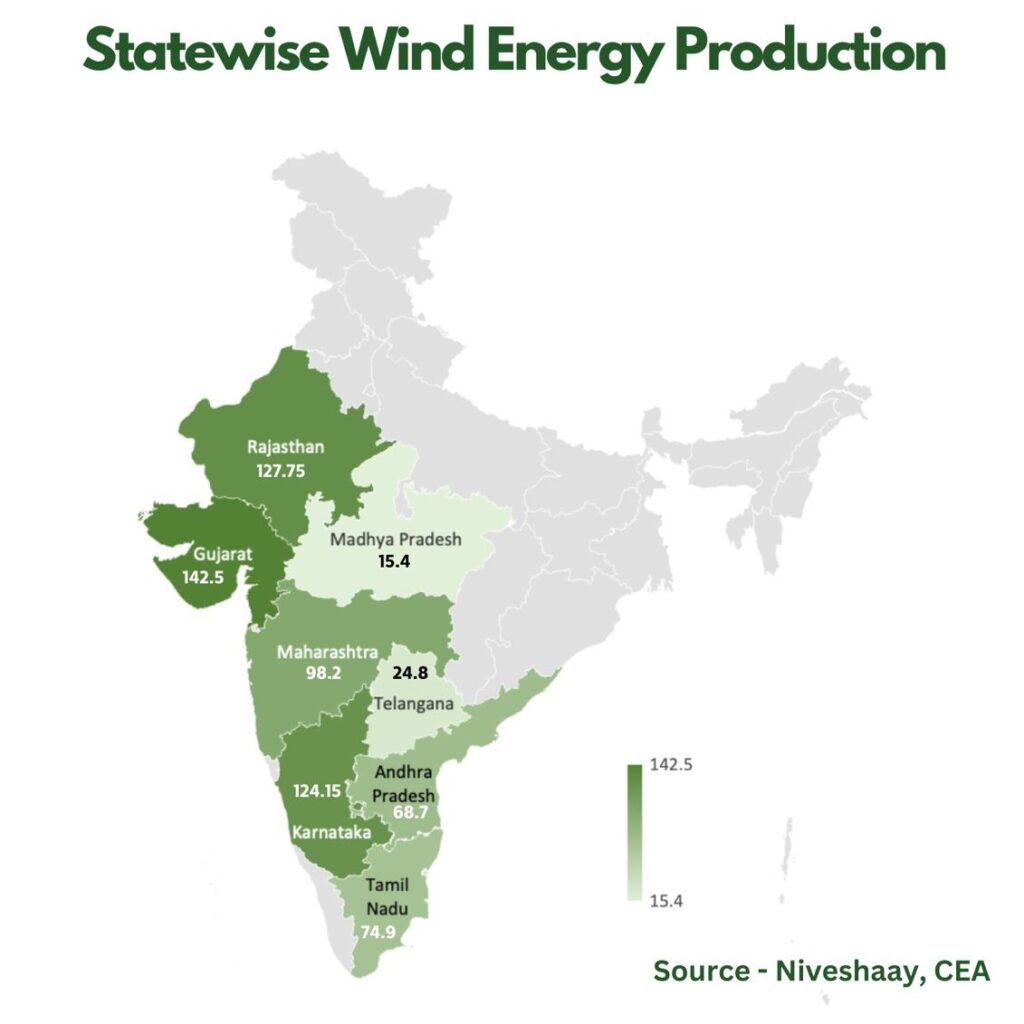
India has a coastline of around 7,517 km and wind energy works really well on the coast because the wind blows faster there. It’s like having a supercharged breeze that helps generate more electricity.
There are 8 windy states in the country where the majority of wind energy is produced and have a potential cumulative capacity of generating 695 GW of wind electricity. Majority of the windy states lie in the coastal region.
We can now say that India has the availability of wind resources. But does India really focus on wind installation to shift its reliance from thermal to renewable energy? Let’s see what the case is.
Wind Capacity in the country (New Installations and Cumulative capacity)
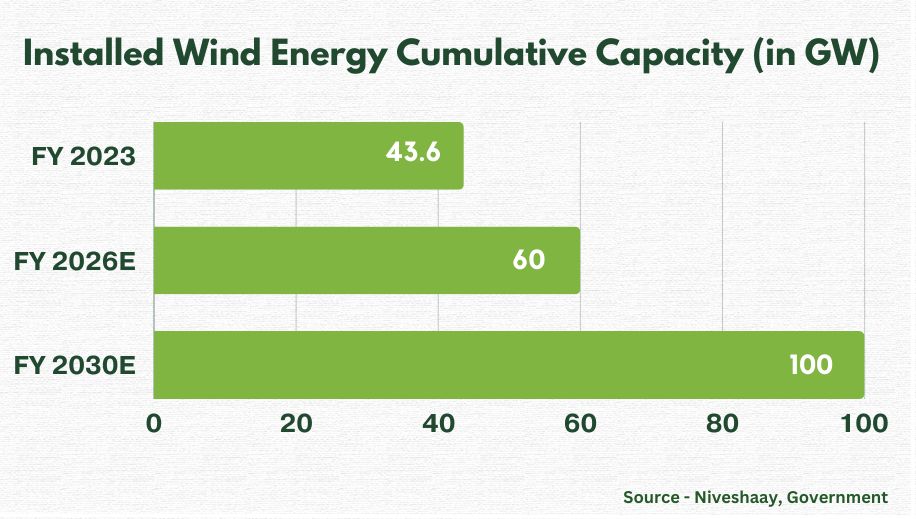
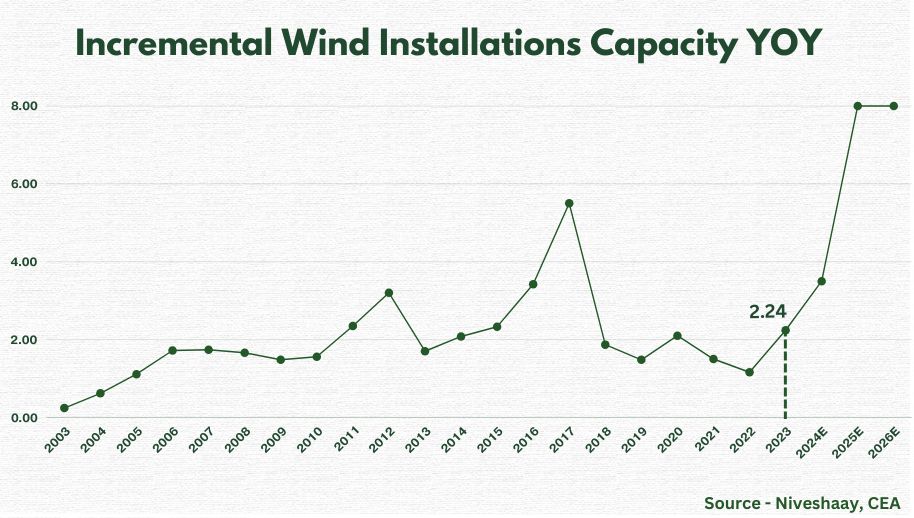
In January 2024, India’s wind power capacity reached around 44.97 GW (43.6 GW as on March 2023), a monumental leap from a mere 1.2 GW in 2000 and the government has targeted to increase the cumulative installed capacity to 60GW by FY26 and to further increase to 100GW by FY30. India ranks fourth globally in terms of installed wind capacity. As we can see from Exhibit 2, though India installed just 2.24 GW of wind energy in FY23, it installed 1.55 GW in H1FY24 alone. It is expected to install around 3.5 GW in FY24, which is around 56.25% higher installations as compared to FY23. The government also targets installing 8 GW of wind energy in FY25 and FY26 each.
The long-term prospects for the wind industry in India remain robust, as the country transitions to competitive, low-carbon technologies, fostering sustainable growth and a cleaner, greener future.
We have already seen a lot of reasons why the Indian wind industry is expected to do well, but let’s list down some more for you.
Why We expect the Indian Wind Industry to do well?
1) Aggressive targets of PSUs
Four PSUs, namely NTPC, NHPC, SECI and SJVN, have committed to bid for 10 GW of wind energy in FY24 across various quarters; this was just 2.5 GW on an average on a yearly basis till now. This will increase the number of wind farm projects developed in the country.
2) Repowering of Wind Farms
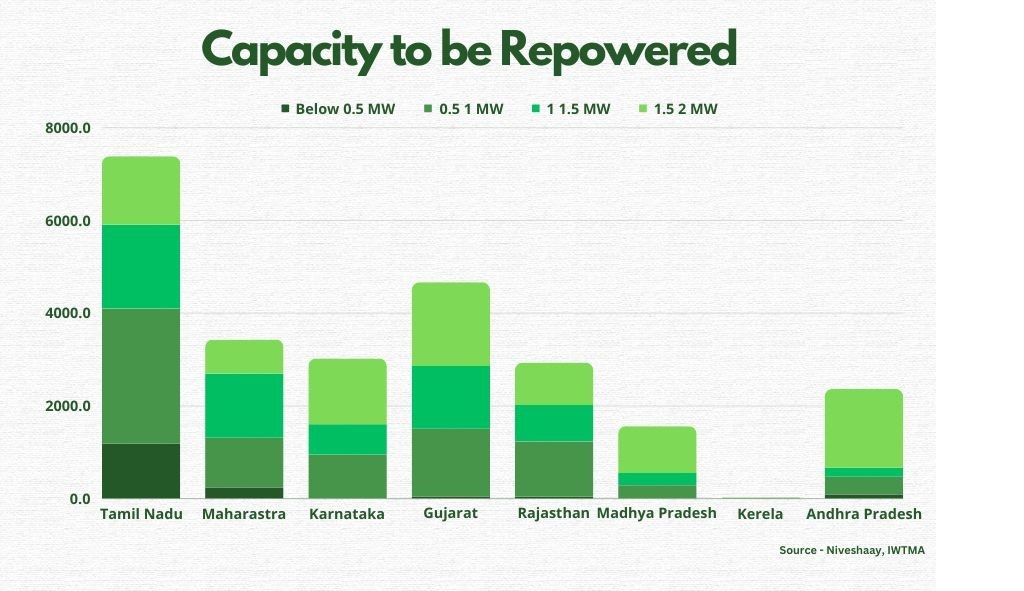
Older plants, like the ones that were set up around the end of the first decade of this century or even before, use obsolete technology; their capacity is only 664 KW and thus proves to be inefficient and more expensive at the project level. New turbines are usually of the capacity of 2 or 3 MW, which makes them a better option. There are government initiatives and the willingness of wind energy players to repower old wind farms. It is expected to give an additional benefit of around 25 GW in the next 5 years (taking into consideration, turbines with a capacity less than 2 MW). This will make wind generation more affordable for the existing plants as well as generate demand for the new turbines.
3) Abolition of Reverse Bidding
There is a revision in the policy which was being followed earlier, and this new policy will lead to better returns generated for power producers. Earlier, we used to follow reverse bidding, where the bidder could revise his bid based on the bids provided by other bidders, whereas now, under competitive bidding, the bidder would not be allowed to revise his bid once submitted, and the bids would be disclosed only at the time of the result declaration.
Under reverse bidding, bidder would keep on lowering their bids to win the tender and this would lead to unsustainable level of IRR. But now, with competitive bidding, there is an increase in tariffs (bid price).
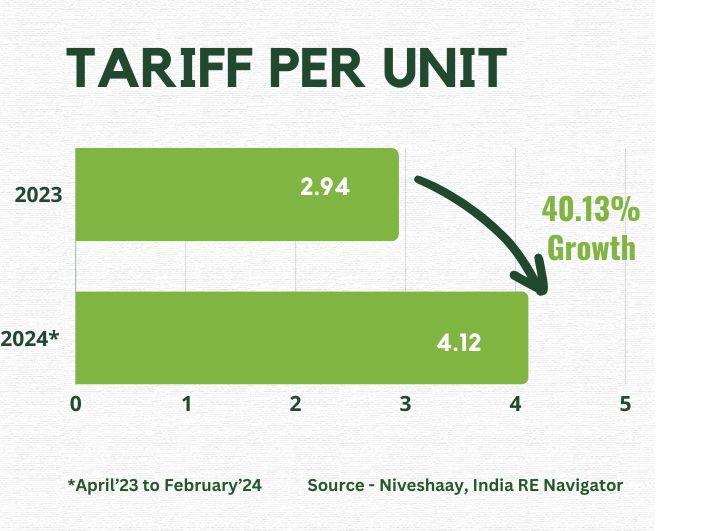
The tariffs went as low as Rs. 2.34/ Unit in 2019, which came to be around Rs. 2.94/ Unit in 2023. This trend can also be confirmed by the fact that of all the auctions generated till now in FY24, on a weighted average basis, the tariff offered is much higher at around Rs. 4.12/unit. This policy change will lead to better rates being offered to the power producers, thus increasing their IRR , which will further motivate them to install wind energy generation capacity.
Challenges in the industry
We have already talked about everything that can go right for the industry, but there is always something that can go wrong, right? So, let’s talk about the things that are not going in favour of the sector.
(1) Delay in execution because of government regulations
Currently, the entire wind sector is operating effectively, but what hinders its progress are government regulations. There is a lot of red tape in the sector and hence the industry is not able to perform in its full swing. Players are not able to get the required land approvals and the bidding process has slowed down. These regulatory issues have been an issue for a very long time and as long as these issues are resolved, we won’t be able to see the sector perform at its full potential.
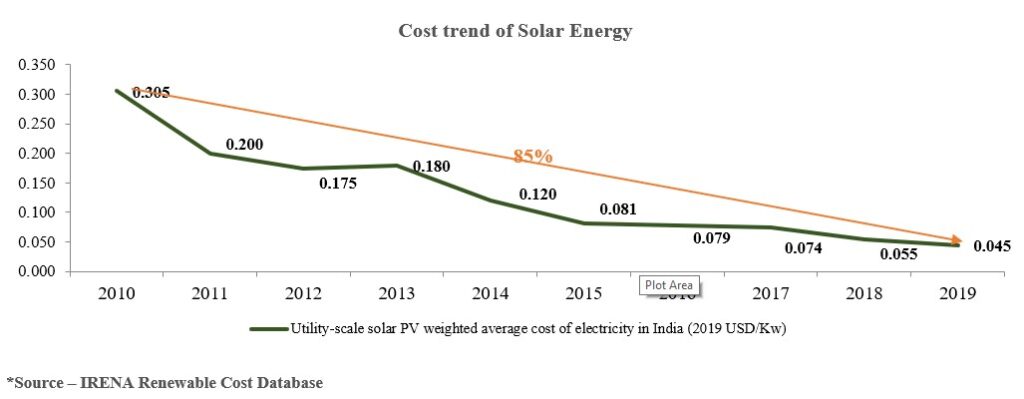
(2) Cost Competitiveness with Solar
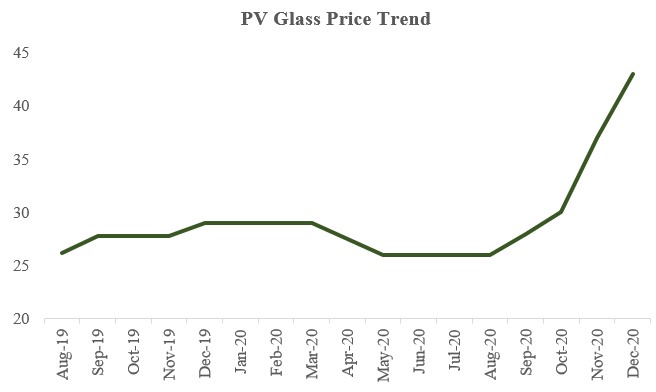
Though till now we have been talking about why it should be wind with solar, we can also not ignore the fact that because of the recent decline in solar module prices, the cost of setting up a solar power plant can decrease which will lead to reduced cost of electricity generated from solar. It can motivate the smaller captive and industrial consumers to move towards solar power plants.
However, large scale IPPs or industrialists would have many regulations to follow which would not allow them to install vanilla solar of such a high capacity and thus they would have to install other sources of energy. Also, because of continuing strain on the power grid during the day, it is expected to have a good growth uptick in wind installations too.
In conclusion, the wind industry has a bright future with a growing focus on sustainability by major PSUs and promising returns it offers. While challenges like regulatory uncertainties exist, we’re optimistic about its growth story. It’s a wait-and-watch moment for all of us. Let’s see how it unfolds.
Sayonara for now! Until our next update.
Disclaimer:
Investment in securities market are subject to market risks. Read all the related documents carefully before investing. The content in these posts/articles is for informational and educational purposes only and should not be construed as professional financial advice and nor to be construed as an offer to buy /sell or the solicitation of an offer to buy / sell any security or financial products.
Registration granted by SEBI, membership of BASL and certification from NISM in no way guarantee performance of the intermediary or provide any assurance of returns to investors.
The securities quoted are for illustration only and are not recommendatory.